Shell Scripting for DevOps Engineers — Log Management & Analysis
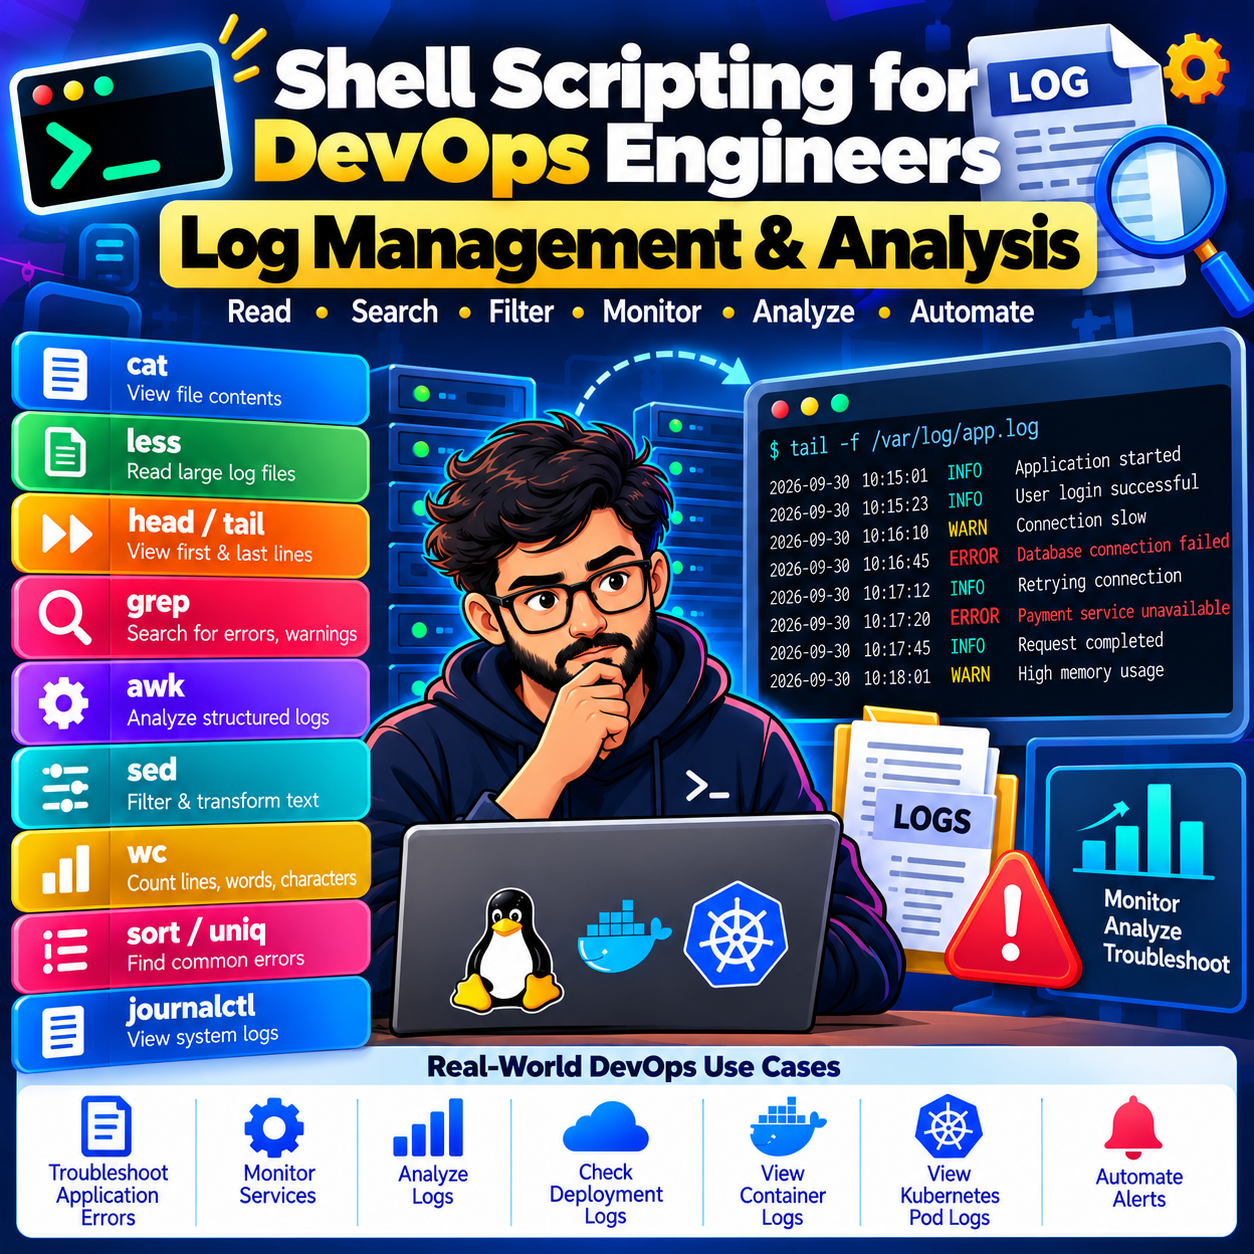
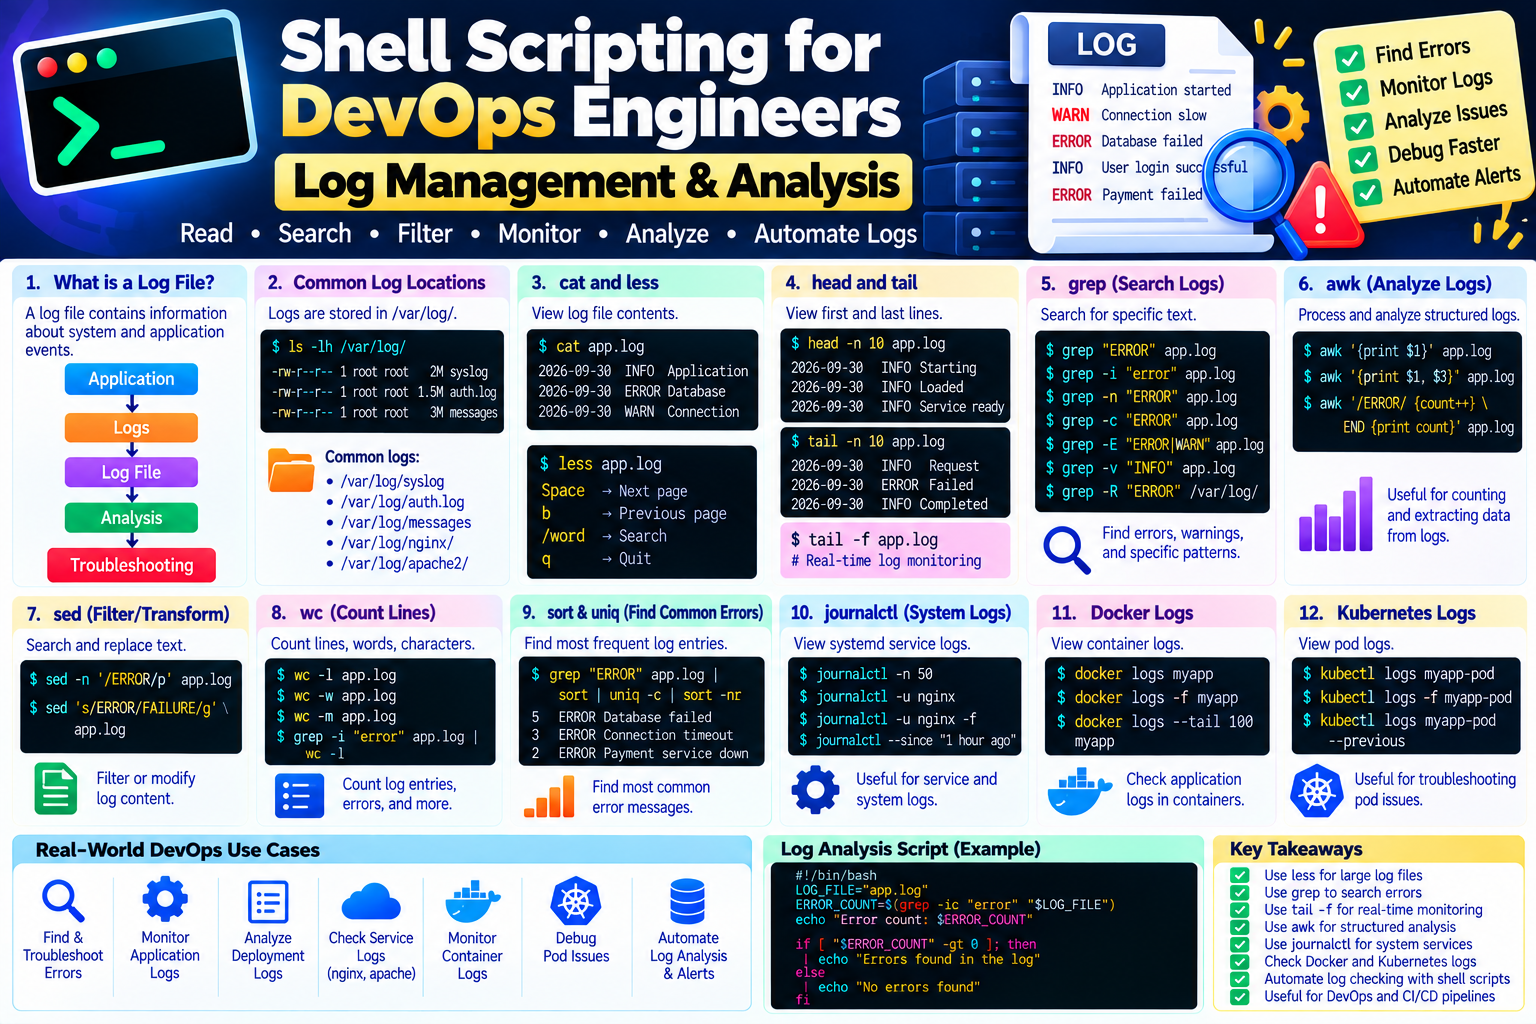
In this article, we will learn how Shell Scripting can help us read, search, filter, monitor, and analyze log files.
Log management is an important DevOps skill because logs help us understand application failures, server issues, deployment problems, authentication failures, and system events.
1. What is a Log File?
A log file contains information about events happening inside a system or application.
For example:
Application
     ↓
    Logs
     ↓
Log File
     ↓
Analysis
     ↓
Troubleshooting
Common Linux log locations include:
/var/log/
Examples:
/var/log/syslog
/var/log/auth.log
/var/log/messages
The exact files depend on the Linux distribution and logging configuration.
2. Why Are Logs Important for DevOps?
Logs help us:
Troubleshoot application failures
Find errors
Monitor applications
Investigate failed deployments
Identify authentication problems
Analyze server issues
Monitor services
Automate alerting and health checks
3. List Log Files
To view the /var/log directory:
ls -lh /var/log/
To see only files:
find /var/log -type f
4. cat Command
cat displays file contents.
cat app.log
For a small log file, this is useful.
However, very large log files can produce a lot of output.
5. less Command
For large files, use:
less app.log
Useful keys:
Space → Next page
b     → Previous page
/word → Search
q     → Quit
Example:
less /var/log/syslog
6. head Command
head displays the beginning of a file.
head app.log
Display the first 20 lines:
head -n 20 app.log
Useful when you want to quickly inspect the beginning of a log.
7. tail Command
tail displays the last lines of a file.
tail app.log
Display the last 20 lines:
tail -n 20 app.log
8. tail -f — Real-Time Log Monitoring
One of the most useful commands for DevOps engineers is:
tail -f app.log
It continuously displays new lines added to the file.
Example:
2026-09-30 16:10:01 INFO Application started
2026-09-30 16:10:10 INFO Request received
2026-09-30 16:10:15 ERROR Database connection failed
This is useful while troubleshooting an application or deployment.
To stop:
Ctrl + C
9. grep Command
grep searches for text inside files.
Find errors:
grep "ERROR" app.log
Find warnings:
grep "WARN" app.log
Find information:
grep "INFO" app.log
10. Case-Insensitive Search
Use -i:
grep -i "error" app.log
This can match:
ERROR
Error
error
11. Show Line Numbers
Use -n:
grep -n "ERROR" app.log
Example:
25:ERROR Database connection failed
47:ERROR Payment service unavailable
This makes it easier to locate the matching lines.
12. Count Errors
Use -c:
grep -c "ERROR" app.log
Example:
15
This means 15 matching lines were found.
13. Search Multiple Patterns
Use:
grep -E "ERROR|WARN" app.log
This searches for both:
ERROR
WARN
14. Exclude Text
Use -v:
grep -v "INFO" app.log
This displays lines that don't contain INFO.
15. Search Recursively
To search through multiple files/directories:
grep -R "ERROR" /var/log/
For a case-insensitive recursive search:
grep -Ri "error" /var/log/
You may need appropriate permissions to read some system logs.
16. Combine tail and grep
This is very useful for real-time monitoring:
tail -f app.log | grep "ERROR"
Now you see only new lines containing ERROR.
You can monitor multiple patterns:
tail -f app.log | grep -E "ERROR|WARN"
17. Using awk for Log Analysis
awk is useful for processing structured text.
Suppose the log contains:
2026-09-30 INFO UserLogin Success
2026-09-30 ERROR Database Failed
2026-09-30 INFO Payment Success
Display the first field:
awk '{print $1}' app.log
Display the second field:
awk '{print $2}' app.log
Display the first and third fields:
awk '{print $1, $3}' app.log
18. Count Specific Log Entries with awk
For example:
awk '/ERROR/ {count++} END {print count}' app.log
This counts lines containing ERROR.
19. Using sed
sed is useful for searching and transforming text.
Display lines containing ERROR:
sed -n '/ERROR/p' app.log
Replace text in output:
sed 's/ERROR/FAILURE/g' app.log
For log analysis, sed is commonly combined with other commands.
20. Using Pipes for Log Analysis
Pipes allow one command's output to become another command's input.
Example:
cat app.log | grep "ERROR"
Another example:
grep "ERROR" app.log | wc -l
This means:
Log File
   ↓
grep ERROR
   ↓
Matching Errors
   ↓
wc -l
   ↓
Error Count
21. wc Command
wc counts lines, words, and characters.
Count lines:
wc -l app.log
Count words:
wc -w app.log
Count characters:
wc -m app.log
Count errors:
grep -i "error" app.log | wc -l
22. Find the Most Common Errors
You can combine grep, sort, and uniq.
For example:
grep "ERROR" app.log | sort | uniq -c | sort -nr
Conceptually:
grep
 ↓
Extract errors
 ↓
sort
 ↓
Group similar lines
 ↓
uniq -c
 ↓
Count occurrences
 ↓
sort -nr
 ↓
Show frequent entries first
23. journalctl
On systems using systemd, journalctl can be used to query the system journal.
View logs:
journalctl
View recent logs:
journalctl -n 50
Follow logs in real time:
journalctl -f
View logs for a service:
journalctl -u nginx
Follow a service's logs:
journalctl -u nginx -f
24. Check Logs for a Specific Time
For example:
journalctl --since "1 hour ago"
Or:
journalctl --since today
This is useful during incident troubleshooting.
25. Shell Script for Error Monitoring
We can automate error detection:
#!/bin/bash

LOG_FILE="app.log"

ERROR_COUNT=$(grep -ic "error" "$LOG_FILE")

echo "Error count: $ERROR_COUNT"

if [ "$ERROR_COUNT" -gt 0 ]
then
    echo "Errors found in the log"
else
    echo "No errors found"
fi
26. Shell Script for Log Monitoring
#!/bin/bash

LOG_FILE="app.log"

if [ ! -f "$LOG_FILE" ]
then
    echo "Log file not found: $LOG_FILE"
    exit 1
fi

echo "Monitoring $LOG_FILE..."

tail -f "$LOG_FILE" | while read -r line
do
    if echo "$line" | grep -qi "ERROR"
    then
        echo "ERROR DETECTED: $line"
    fi
done
This continuously watches the log and prints lines containing ERROR.
27. Real-Time DevOps Example — Deployment Logs
Suppose Jenkins deploys an application.
During deployment:
Jenkins
   ↓
Build
   ↓
Deploy
   ↓
Application Start
   ↓
Application Logs
We can monitor:
tail -f /var/log/application.log
If we see:
ERROR Database connection failed
we can investigate:
Database connectivity
Credentials
Security rules
DNS
Application configuration
Database availability
28. Log Monitoring with CI/CD
A shell script can check deployment logs:
#!/bin/bash

LOG_FILE="deployment.log"

if grep -qi "FAILED" "$LOG_FILE"
then
    echo "Deployment failed"
    exit 1
fi

if grep -qi "ERROR" "$LOG_FILE"
then
    echo "Errors detected during deployment"
    exit 1
fi

echo "Deployment log check passed"
This can be used as a CI/CD pipeline step.
29. Log Analysis with Docker
Docker provides container logs using:
docker logs <container-name>
Example:
docker logs myapp
Follow logs:
docker logs -f myapp
Show the last 100 lines:
docker logs --tail 100 myapp
Search errors:
docker logs myapp 2>&1 | grep -i "error"
30. Log Analysis with Kubernetes
Kubernetes provides:
kubectl logs <pod-name>
Example:
kubectl logs myapp-pod
Follow logs:
kubectl logs -f myapp-pod
For a specific container:
kubectl logs myapp-pod -c app
For a previous container instance:
kubectl logs myapp-pod --previous
This is particularly useful when a container has restarted or crashed.
31. Real-Time Kubernetes Troubleshooting
Suppose a Pod is restarting.
Start with:
kubectl get pods
Then:
kubectl describe pod <pod-name>
Then:
kubectl logs <pod-name>
If the container restarted:
kubectl logs <pod-name> --previous
Basic flow:
Pod Problem
    ↓
kubectl get pods
    ↓
kubectl describe pod
    ↓
kubectl logs
    ↓
--previous if needed
    ↓
Find Error
    ↓
Troubleshoot
32. Log Analysis Script
Here is a simple reusable script:
#!/bin/bash

LOG_FILE="$1"

if [ -z "$LOG_FILE" ]
then
    echo "Usage: $0 <log-file>"
    exit 1
fi

if [ ! -f "$LOG_FILE" ]
then
    echo "File not found: $LOG_FILE"
    exit 1
fi

echo "=============================="
echo "Log Analysis Report"
echo "=============================="

echo "Total Lines:"
wc -l < "$LOG_FILE"

echo "Errors:"
grep -ic "error" "$LOG_FILE"

echo "Warnings:"
grep -ic "warn" "$LOG_FILE"

echo "=============================="
Run:
./log-analysis.sh app.log
Example output:
==============================
Log Analysis Report
==============================
Total Lines:
1500

Errors:
12

Warnings:
35
==============================
33. Important Log Commands Cheat Sheet
| Command | Purpose |
|---|---|
cat |
Display file |
less |
Read large files |
head |
First lines |
tail |
Last lines |
tail -f |
Real-time monitoring |
grep |
Search text |
grep -i |
Case-insensitive search |
grep -n |
Show line numbers |
grep -c |
Count matches |
awk |
Process structured text |
sed |
Transform/filter text |
sort |
Sort output |
uniq |
Remove/count duplicates |
wc |
Count lines/words/chars |
journalctl |
Query systemd journal |
34. Best Practices
✅ Use less for large log files.
✅ Use grep to quickly search errors.
✅ Use tail -f for real-time monitoring.
✅ Use awk for structured log analysis.
✅ Use journalctl for systemd services.
✅ Validate that log files exist before processing them.
✅ Avoid storing passwords, API keys, or other secrets in logs.
✅ Use proper log rotation for continuously growing log files.
✅ Use centralized logging solutions for large production environments.
🎯 Key Takeaways
              LOG MANAGEMENT
                    ↓
       ┌────────────┴────────────┐
       ↓                         ↓
    Read Logs               Monitor Logs
       ↓                         ↓
cat / less                 tail -f
       ↓                         ↓
    Search                    Filter
       ↓                         ↓
   grep / awk                sed
       ↓                         ↓
    Analyze                    Count
       ↓                         ↓
 sort / uniq / wc          Error Detection
       ↓                         ↓
       └──────────→ DevOps Automation
You should now understand:
✅ Linux log files ✅ cat and less ✅ head and tail ✅ tail -f ✅ grep ✅ awk ✅ sed ✅ sort and uniq ✅ wc ✅ journalctl ✅ Docker logs ✅ Kubernetes logs ✅ Real-time monitoring ✅ Automated error detection ✅ CI/CD log analysis
Logs are one of the most important sources of information during DevOps troubleshooting. Shell scripting allows us to automate log searching, filtering, monitoring, and error detection.